Nevada's 2021 Graduation Rate Remains Above 80 Percent Five Years in a Row

November 17, 2021

CARSON CITY, Nev. – The Nevada Department of Education (NDE or Department) announced today that the Class of 2021 maintained Nevada’s graduation rate at above 80 percent for the fifth consecutive year. The Statewide graduation rate for the Class of 2021 is 81.31 percent, representing a slight decrease of 1.26 percentage points compared to the Class of 2020.

Key takeaways from the Class of 2021 graduation data include: 

  • In 13 of Nevada’s 17 school districts as well as the State Public Charter School Authority (SPCSA), students graduated at a higher rate than the State average of 81.31 percent.
  • Nine of Nevada’s 17 school districts showed increases in graduation rates from the previous year, with Storey County School District (CSD) showing the highest gain from 85.00 to 97.06 percent, a 12.1 percentage point gain over the previous year. 
  • Other districts with large year-to-year increases in graduation rates include Nye CSD (5.82), Churchill CSD (3.02), Humboldt CSD (2.94), the SPCSA (2.78), and Lincoln CSD (2.40) 
  • Career and Technical Education students maintained one of the highest graduation rates of all student groups at 91.72 percent.  
  • Five districts had 2021 graduation rates that exceeded 90 percent. They include: 
    • Esmeralda CSD at 100.00 percent.
    • Storey CSD at 97.06 percent 
    • Lincoln CSD at 96.43 percent 
    • Humboldt CSD at 94.23 percent 
    • Pershing CSD at 94.12 percent    

“The Class of 2021 experienced several unprecedented challenges, and this cohort of students, along with our educators and families, have demonstrated resilience throughout the last two school years,” said Jhone Ebert, State Superintendent Jhone Ebert. “I commend these students, and we are infinitely proud to see our graduation rates increase in many of our school districts. The slight decrease in our Statewide rate and among student groups underscores the need for accelerated work, and the Department is committed to supporting this work and collaborating with our school districts to ensure that each student is set up for success in school and life.”

The full list of graduation rates and class sizes for the Class of 2021, including comparisons to 2020 graduation rates, is as follows:

Entity

2021

2020

Class of 2021 Class Size

Statewide

81.31

82.57

30,479

Carson City

85.71

84.04

528

Churchill

79.91

76.89

175

Clark

80.94

83.17

20,792

Douglas

84.53

88.91

399

Elko

79.70

82.48

530

Esmeralda

100

NA

1

Eureka

73.33

90.91

11

Humboldt

94.23

91.29

196

Lander

66.67

81.97

44

Lincoln

96.43

94.03

54

Lyon

87.98

86.58

549

Mineral

88.89

91.67

24

Nye

83.09

77.27

344

Pershing

94.12

94.87

32

SPCSA

86.89

84.11

1,843

Storey

97.06

85.00

33

Washoe

82.48

85.11

4,062

White Pine

83.76

82.88

98


Graduation Rate Comparison Between 2020 and 2021 Disaggregated by Student
Race/Ethnicity 

  • The graduation rate for students who identify as American Indian/Alaska Native decreased 2.21 percentage points to 72.17 percent.
  • The graduation rate for students who identify as Asian decreased 0.53 percentage points to 92.83 percent. 
  • The graduation rate for students who identify as Black/African American increased 0.71 percentage points to 70.25 percent. 
  • The graduation rate for students who identify as Hispanic/Latino decreased 1.62 percentage points to 79.63 percent. 
  • The graduation rate for students who identify with two or more races decreased 1.67 percentage points to 83.36 percent. 
  • The graduation rate for students who identify as Pacific Islanders decreased 1.39 percentage points 83.65 percent. 
  • The graduation rate for students who identify as White decreased 1.44 percentage points to 84.99 percent.   

Graduation Rate Comparison Between 2020 and 2021 Disaggregated by Student Special Populations  

  • The graduation rate for students from families experiencing poverty decreased 0.08 percentage points to 79.01 percent.
  • The graduation rate for students with disabilities decreased 1.51 percentage points to 64.53 percent. 
  • The graduation rate for students who are English Learners (EL) decreased 4.13 percentage points to 71.14 percent. 
  • The graduation rate for students who are experiencing transient housing (homeless) increased 1.77 percentage points to 63.25 percent.  

Please note: 2020-21 Graduation Rate Data is being populated on the Nevada Report Card and will be live by 5:00 p.m. on November 17, 2021. Access the Four-Year Adjusted Cohort Graduation Rates via PDF. 

### 

ABOUT THE NEVADA DEPARTMENT OF EDUCATION

The Nevada Department of Education (NDE) leads and collaborates with Nevada’s 17 school districts and the State Public Charter School Authority to advance educational equity Statewide. With offices in Carson City and Las Vegas, NDE oversees all pre-K-12 education in the State, working to achieve its mission to improve student achievement and educator effectiveness by ensuring opportunities, facilitating learning, and promoting excellence.
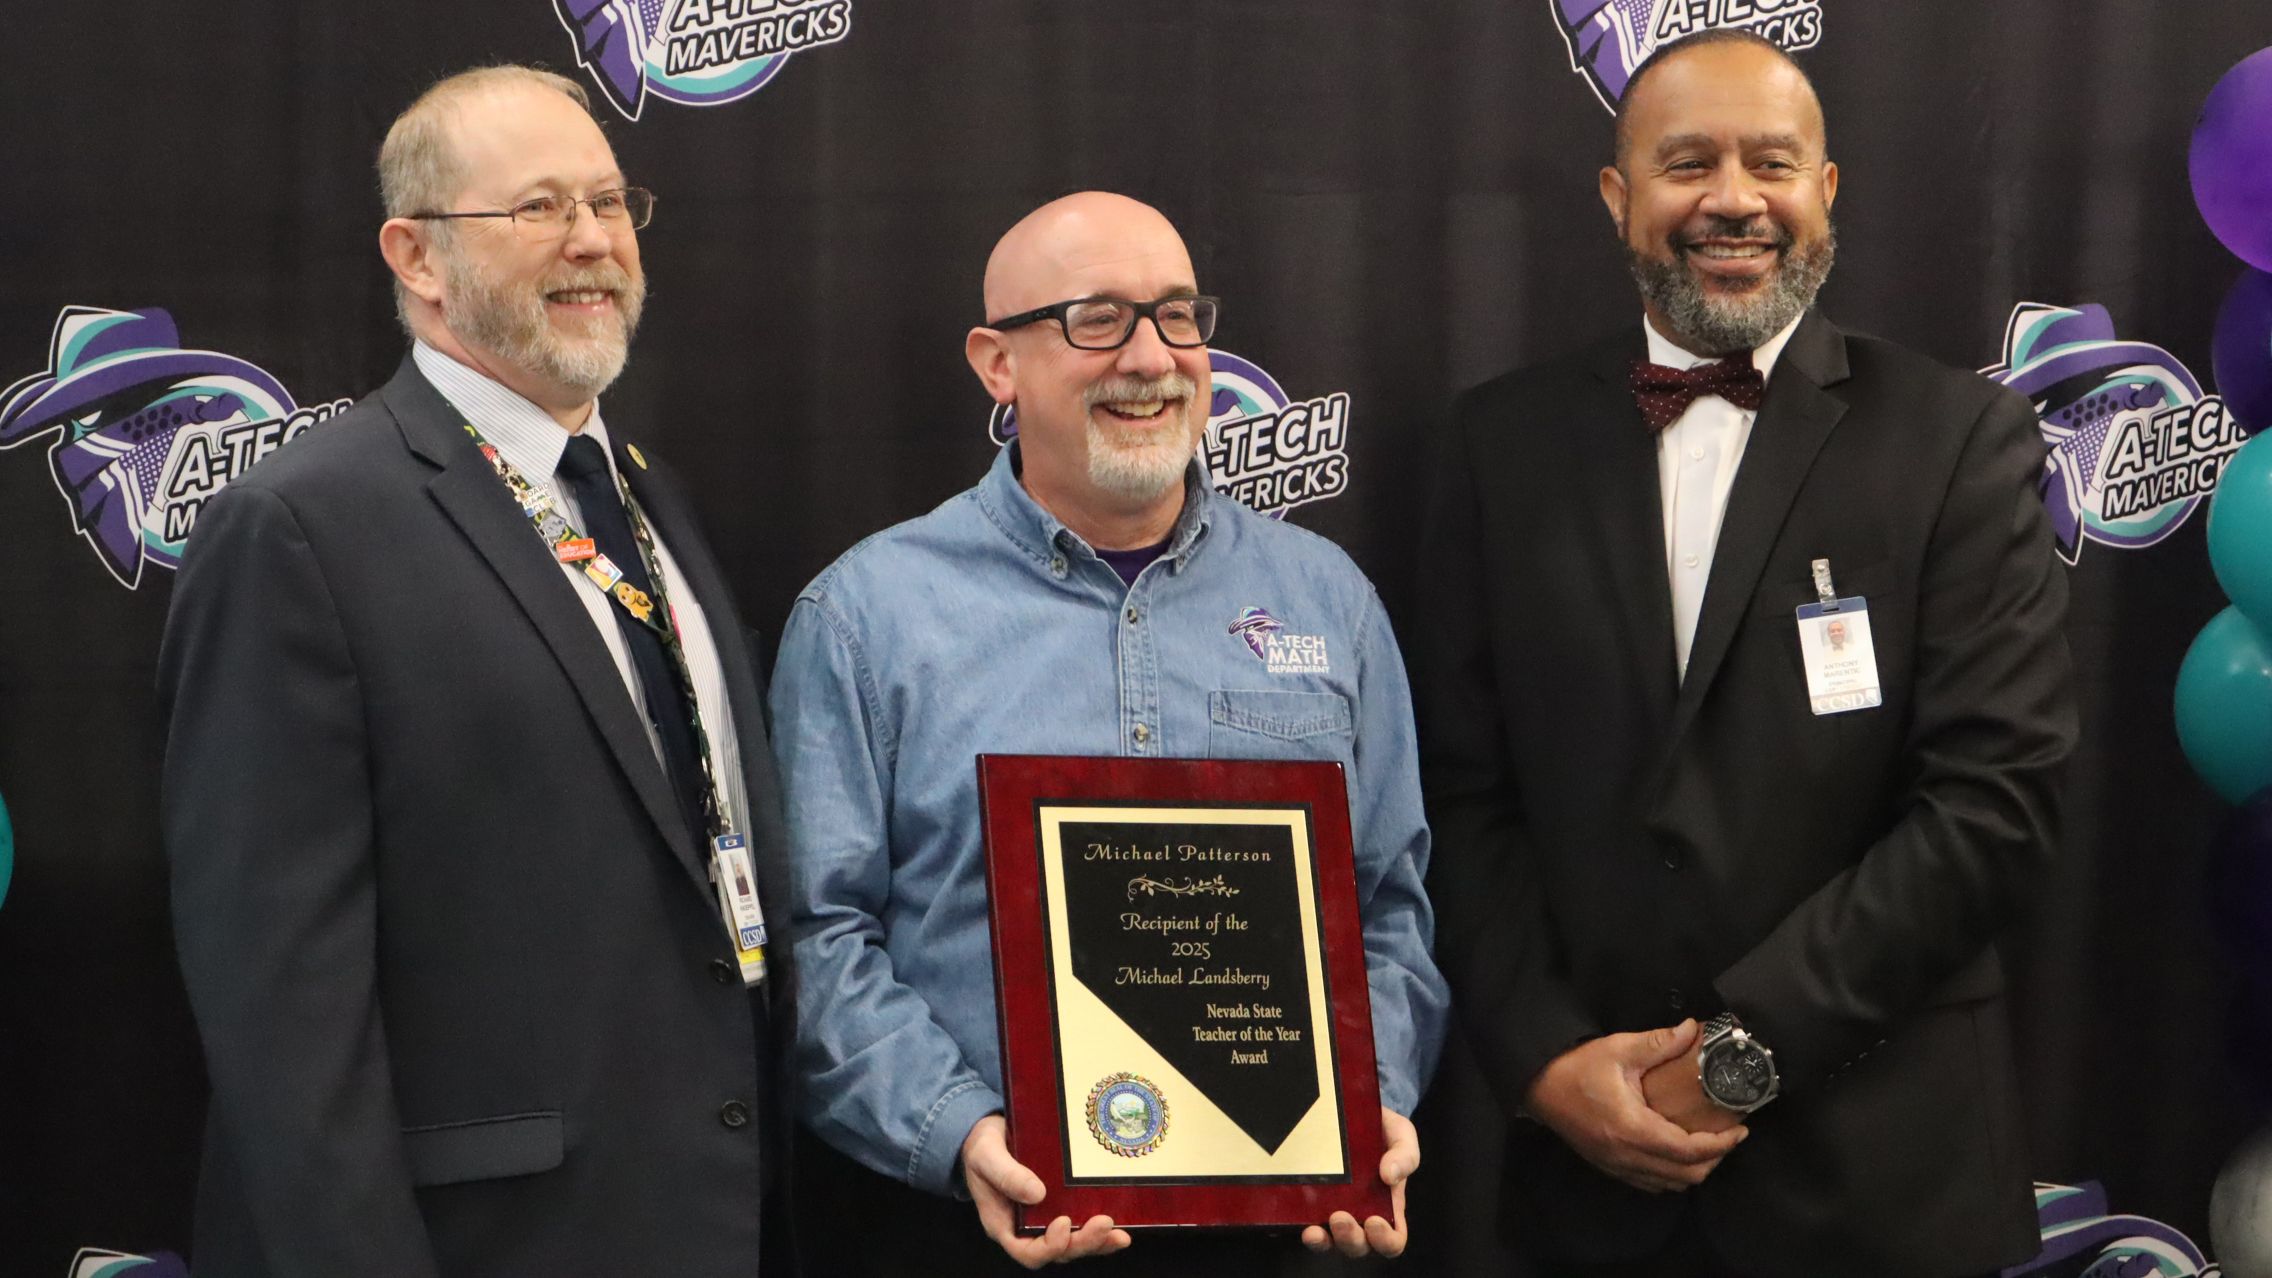
 Under the leadership of the State Board of Education and the Superintendent of Public Instruction, NDE impacts the achievement of nearly half a million children and 30,000 educators.


Contact

Allegra Demerjian
Public Information Officer
775-687-9201