
How Do I Find…
- SafeVoice Nevada 1-833-216-SAFE (7233)
- Public Meetings
- Public Comment: Language Access Plan
- Public Comment: Nevada’s ESSA State Plan Amendment
- Strategic Priorities
- Become an Educator
- Nevada Report Card
- IDEA Dispute Resolution
- Strategic Improvement Plan (STIP)
- Standards & Instruction - Office of Teaching and Learning
From NDE
- 7/1/2026 - Nevada Ready! Pre-K Common Application Launches July 1
- 5/8/2026 - Two Washoe County Campuses Named Nevada Blue Ribbon Schools
- 4/17/2026 - Nevada Department of Education Invests in Clark County Feeder Pilot Project
- 4/1/2026 - Nevada Department of Education Announces 36 Purple Star Schools
- 3/23/2026 - Nevada Department of Education Seeks Public Comment on IDEA Application
- 3/11/2026 - Nevada Department of Education Announces New Strategic Priorities
- 3/3/2026 - Nevada Department of Education Announces New Deputy Superintendent


Inside NDE

FROM STATE SUPERINTENDENT
Dr. Victor Wakefield
Over the past several months, it has been a privilege to serve as Nevada’s State Superintendent of Public Instruction. During this time, I have had the opportunity to listen, learn, and connect with educators, students, families, and community partners across our state. My career in education began in a fifth-grade classroom, where I saw firsthand both the barriers that can limit opportunity and the powerful difference that strong instruction, high expectations, and meaningful support can make for students.

Mission Statement
Our mission is to improve student achievement and educator effectiveness by ensuring opportunities, facilitating learning, and promoting excellence.
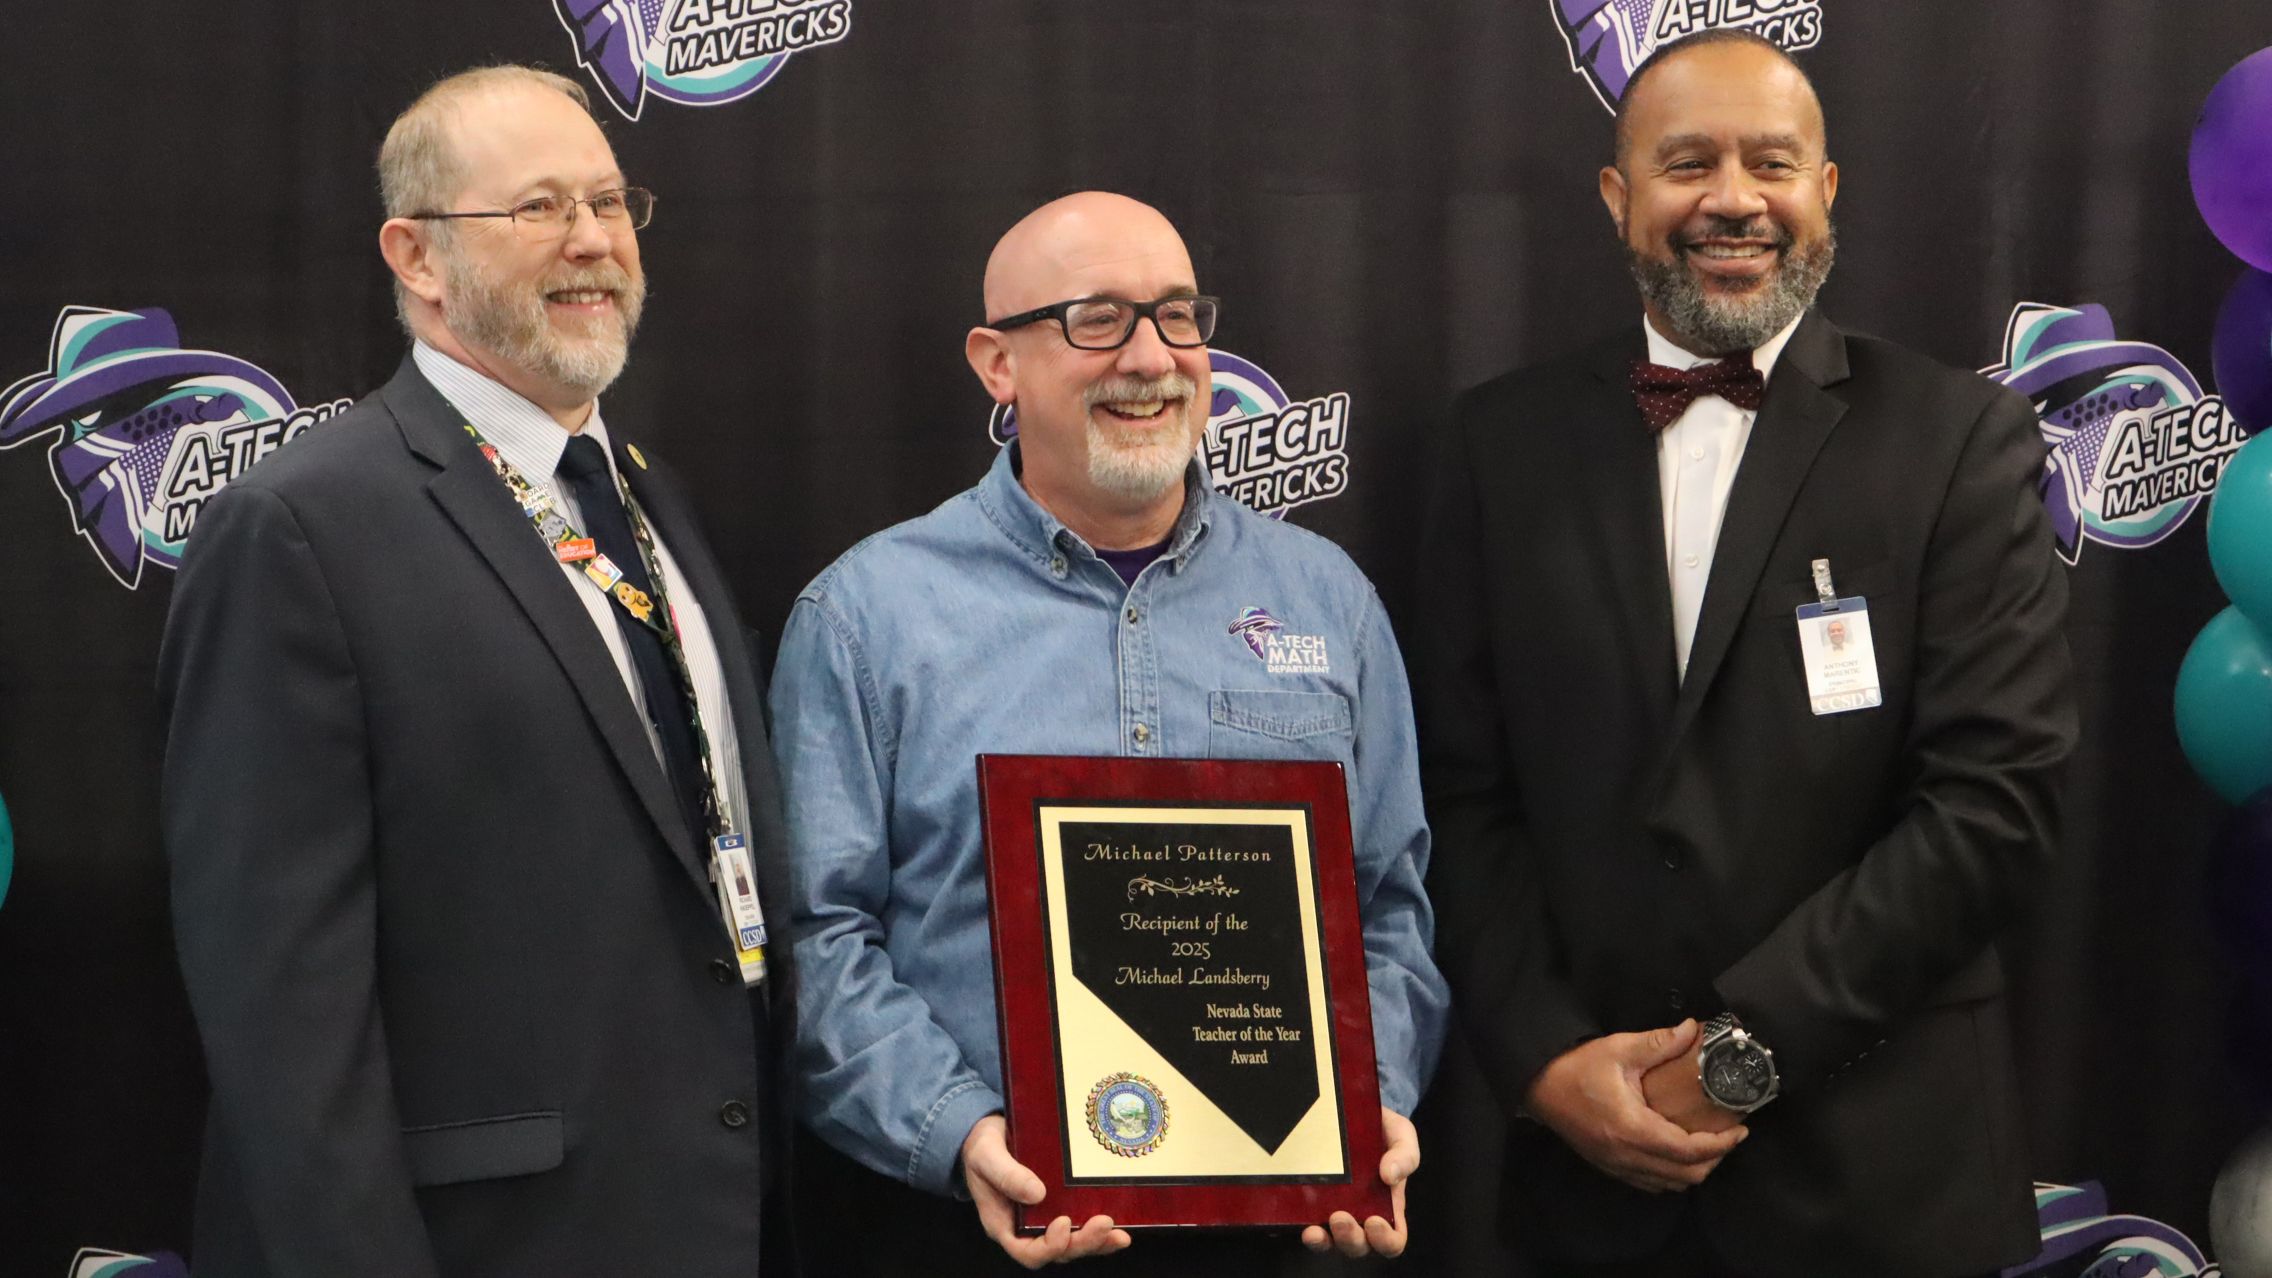
Celebrating & Supporting Current and Future Educators
The mission of the Nevada Teacher of the Year program is to celebrate excellence and strengthen the teaching force by honoring and recognizing exceptional teachers on a school, district, state, and national level.

Transparency & Reliability
Districts, schools, and communities are served through efficient and effective use of public funds and fulfillment of statutory responsibilities.